EVA Mission Planner
Decision support for mission control, built at the Kosmo-Piter hackathon: it compares time windows for an ISS spacewalk by space weather, radiation and orbit. I built the operator interface.
Closed source
git clone eva-mission-plannerAccess denied: the repository is private.Ask me for a demoThe problem
People who plan a spacewalk gather space weather, radiation and debris warnings from separate sources and put them together by hand. EVA Mission Planner, built at the Kosmo-Piter hackathon, puts them on one screen.
How it works
An operator enters the planned start and length of a spacewalk and sees it next to shifted alternatives, each with a risk level, the factors behind it and their sources. Incomplete data can never produce a low-risk verdict, and a past date can be replayed using only the data available at the time.
What I did
Frontend and product lead in a team of three. I designed and built the operator interface in plain JavaScript and SVG, wrote the contract between the risk engine and the interface, and wrote the documentation.
Status
A working prototype, shown in a live demo at the hackathon. The code is in the organizers' private repository, so there is no public link.
- Role
- Frontend and product lead in a team of three
- Team
- Roman Rynda, Frontend, UI/UX, product, documentation
- Vladislav Vasilevskiy, Data pipeline and orbital calculations
- Vyacheslav Miksha, Backend and risk engine, pitch
- Period
- Sep 2026
- Status
- Prototype
- Stack
- JavaScript, HTML, CSS, SVG, Python, FastAPI, SGP4, Docker, NOAA SWPC data, Space-Track data
Key features
- Enter a planned spacewalk and compare it with shifted alternatives side by side
- A verdict for every window, with the factors behind it and the source of each number
- Timeline of space weather, radiation and debris conjunctions against the spacewalk
- ISS ground track over the South Atlantic Anomaly, drawn in pure SVG
- Replay of past events, such as the G5 storm of May 2024, without peeking at future data
- Export to JSON and a print layout for a paper briefing
Recommended 13:00–19:30
- Max Kp
- 5
- Proton flux
- normal
- SAA passes
- 1
Sources: NOAA SWPC, Space-Track (sample values)
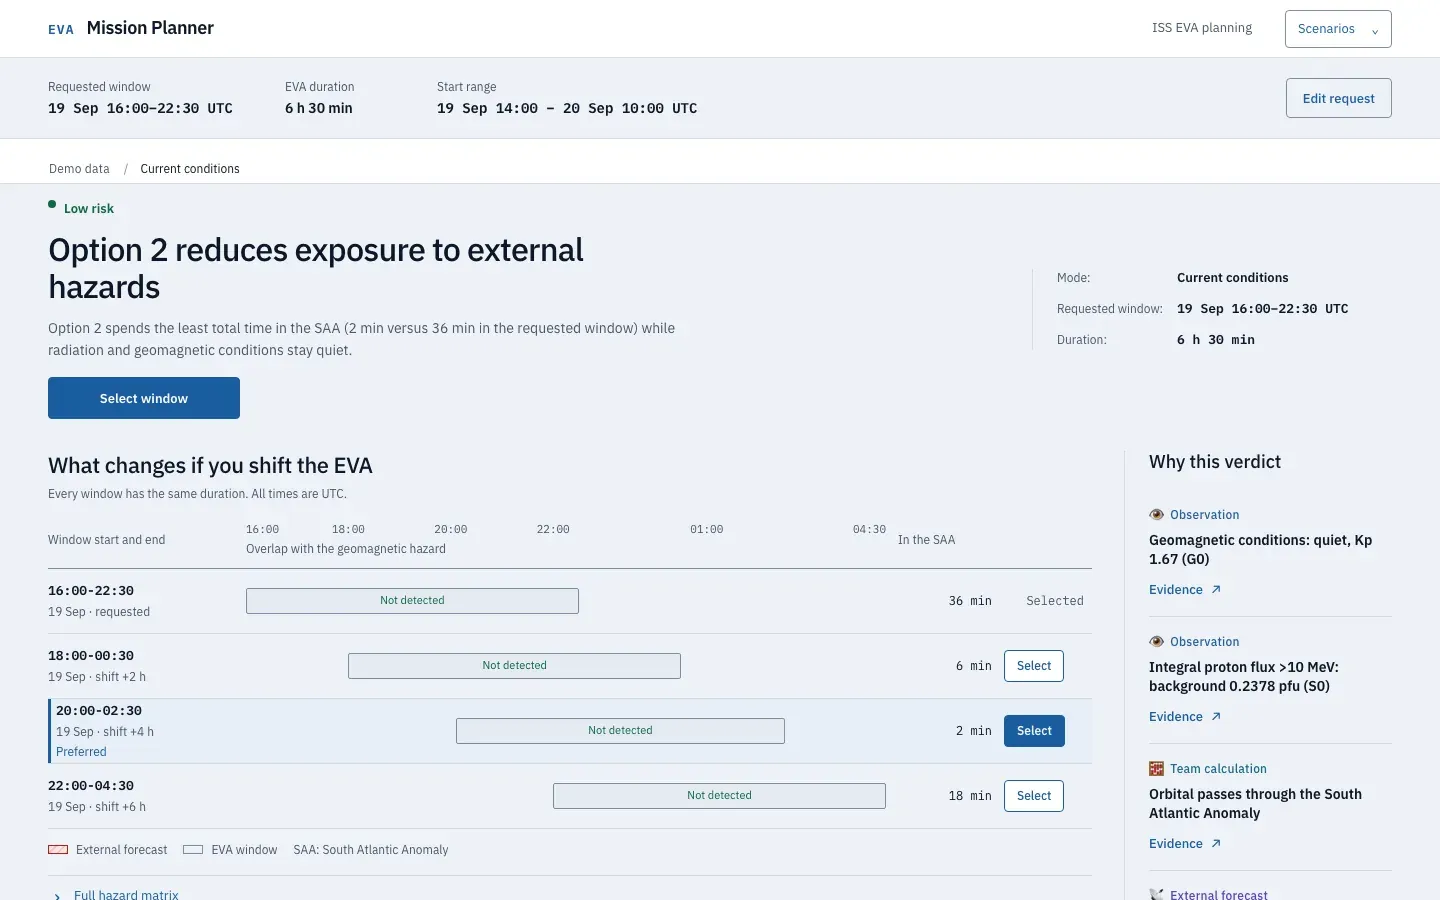
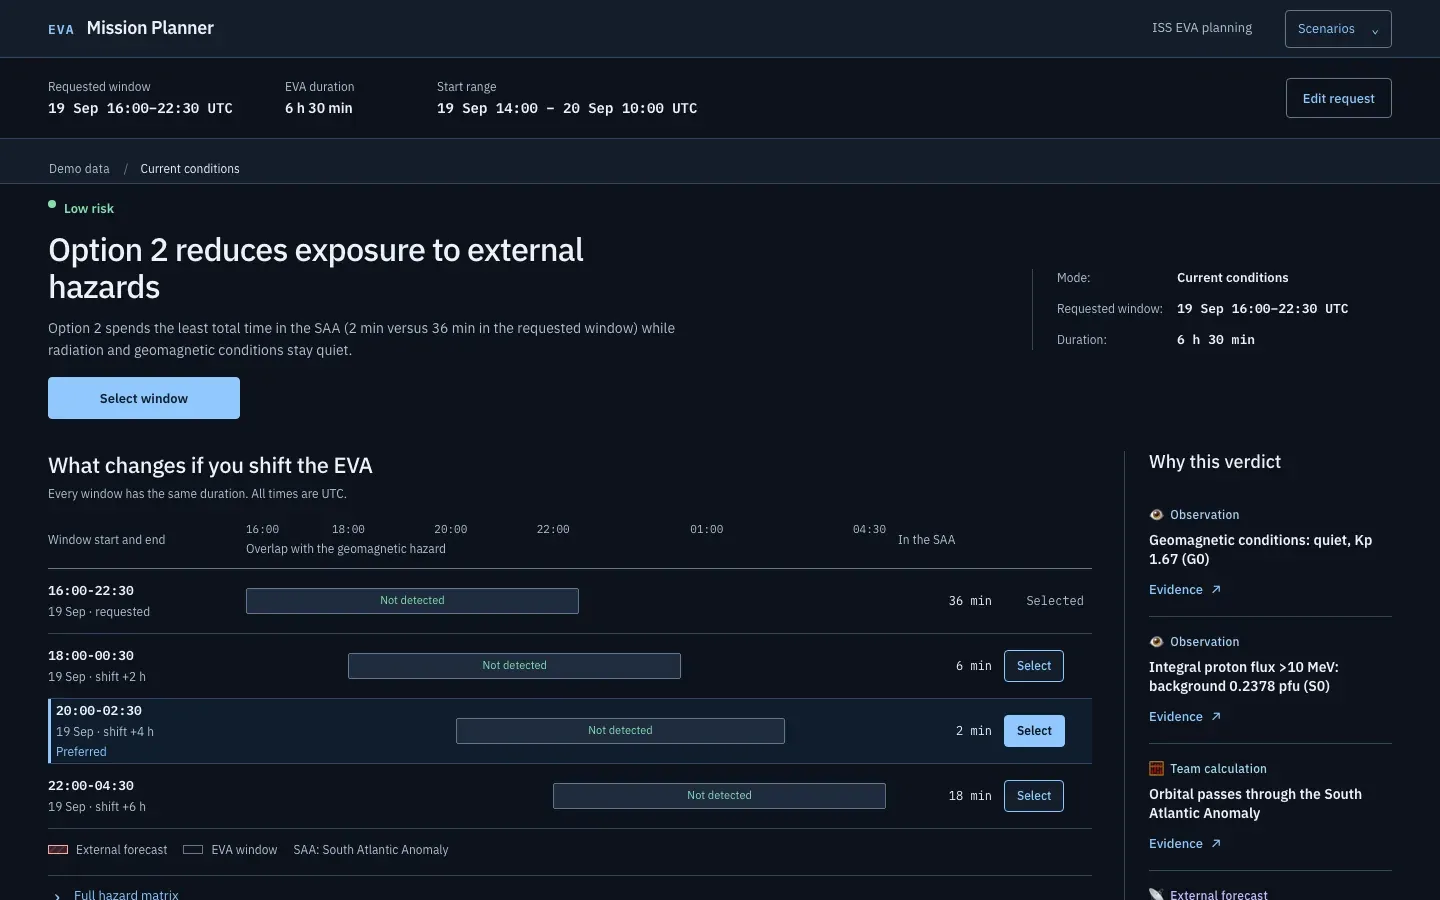
The overview: a verdict in plain words, the windows side by side, and on the right why the system thinks so.
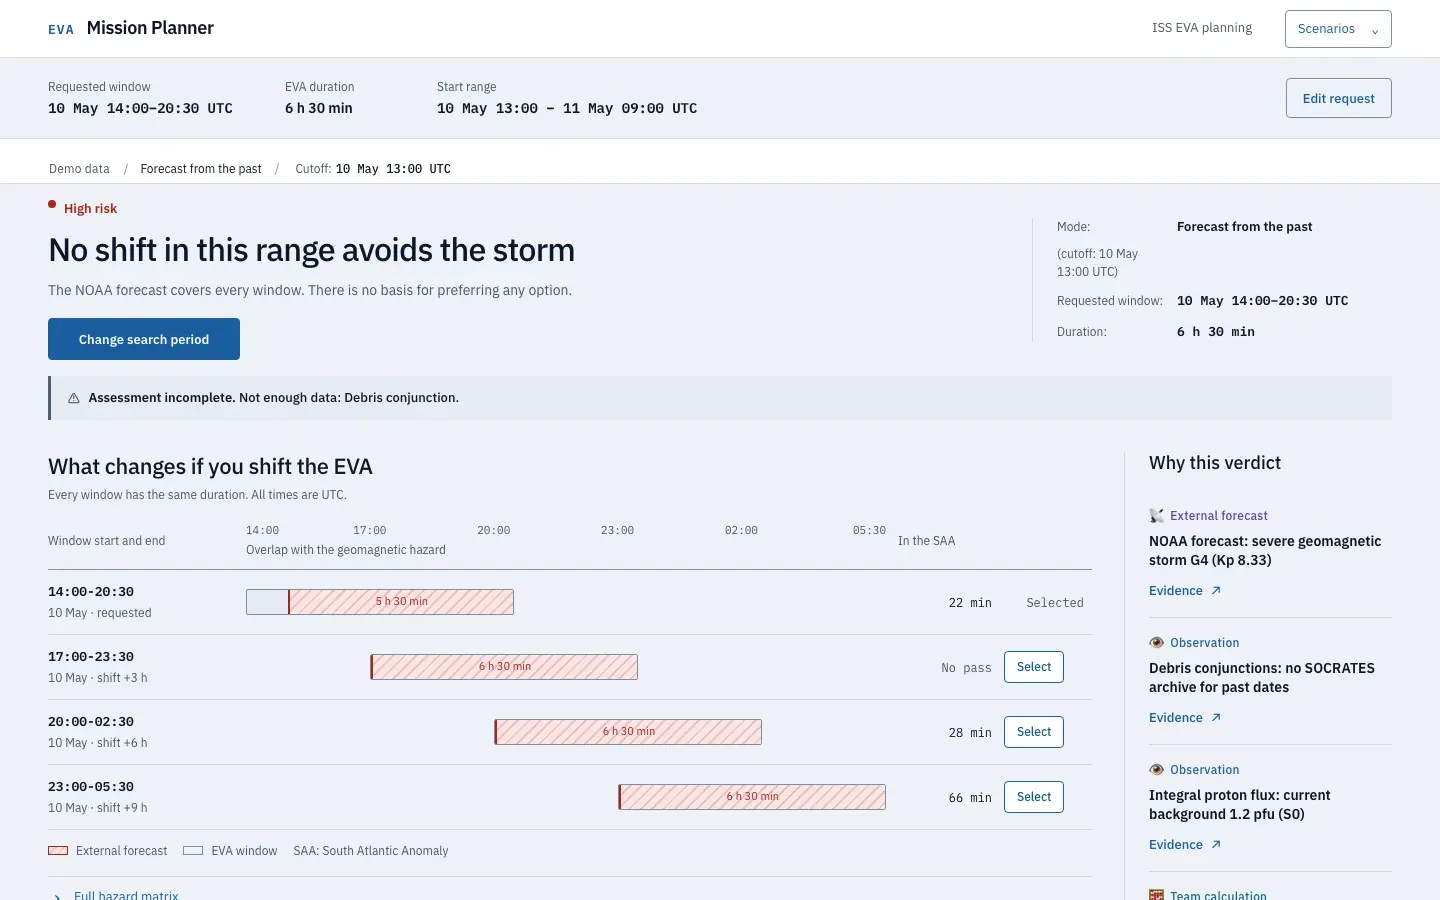
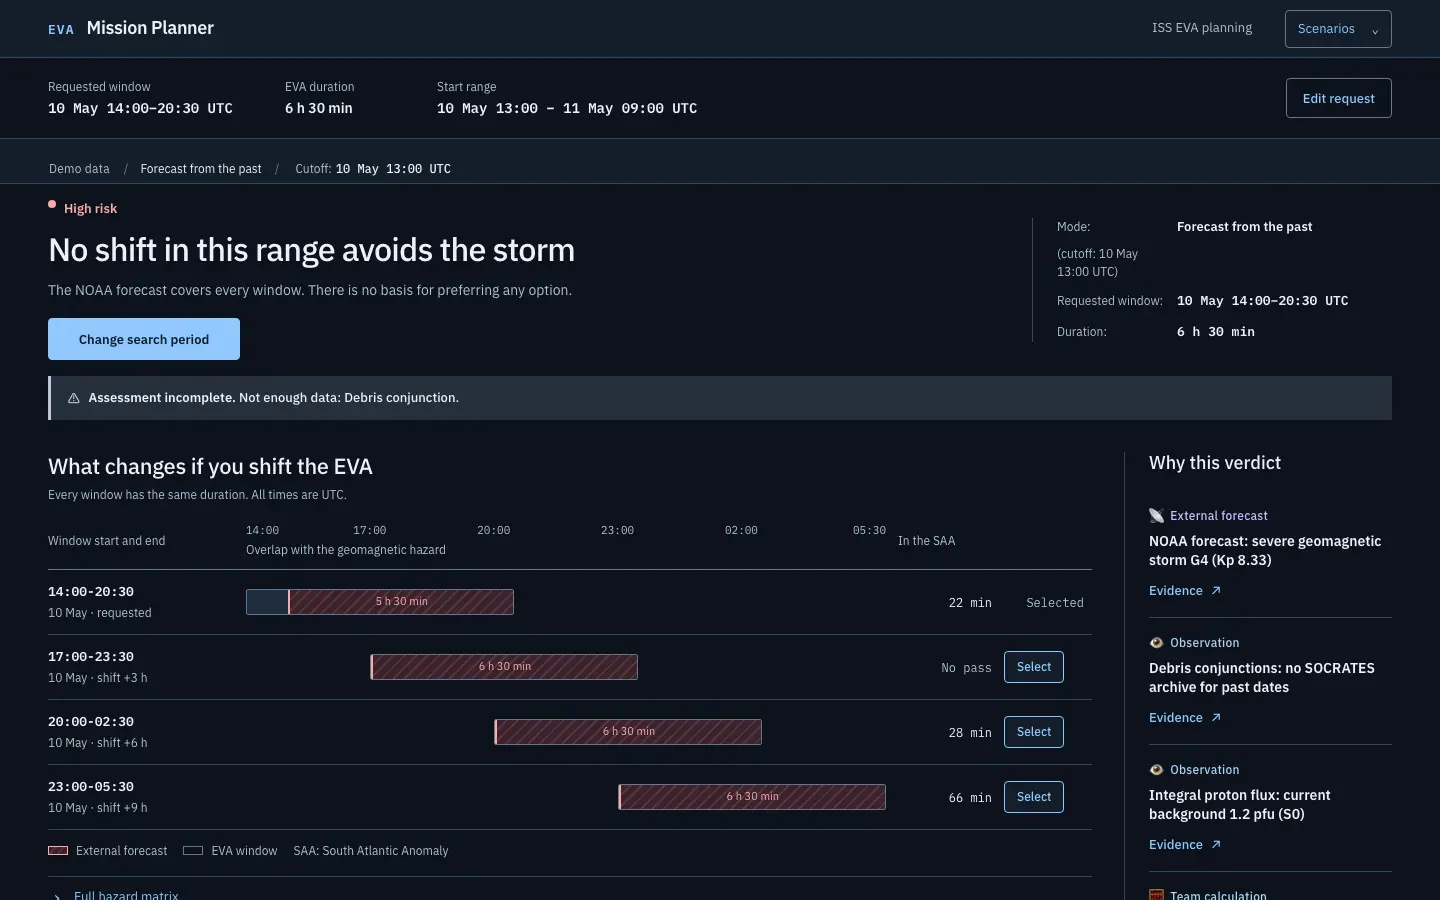
Replay of the G5 storm of May 2024: the system says honestly that no window in the range avoids it.
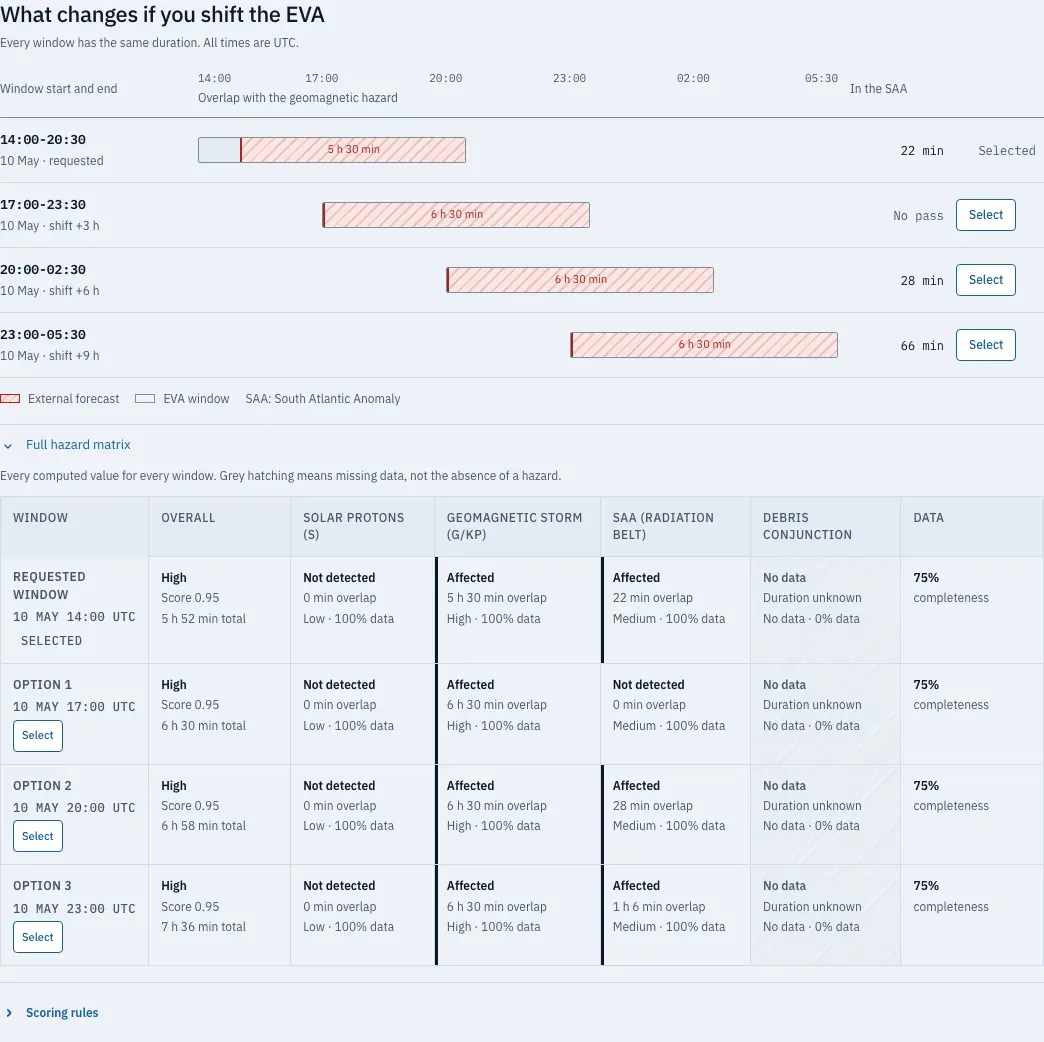
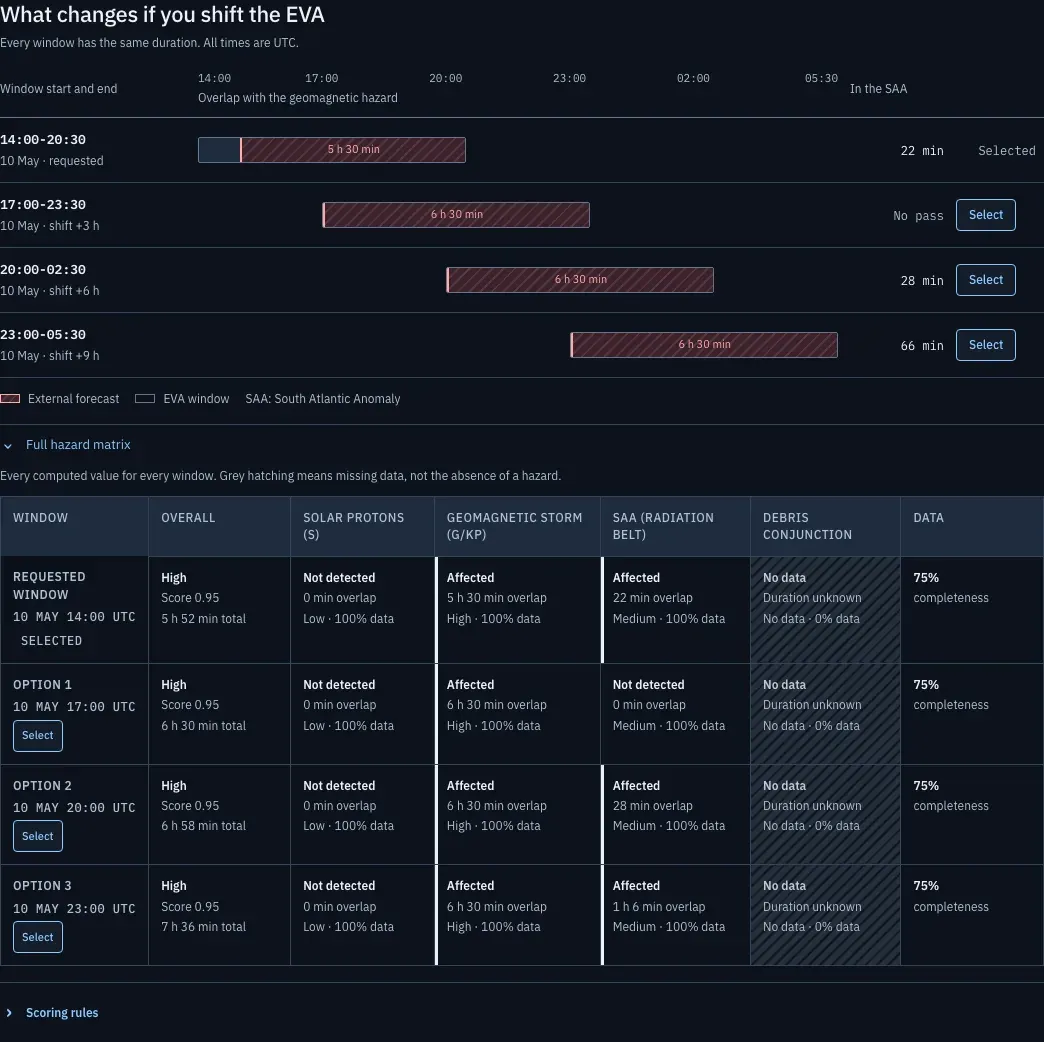
The full matrix: every risk factor for every window, and hatching where data is missing instead of a fake zero.
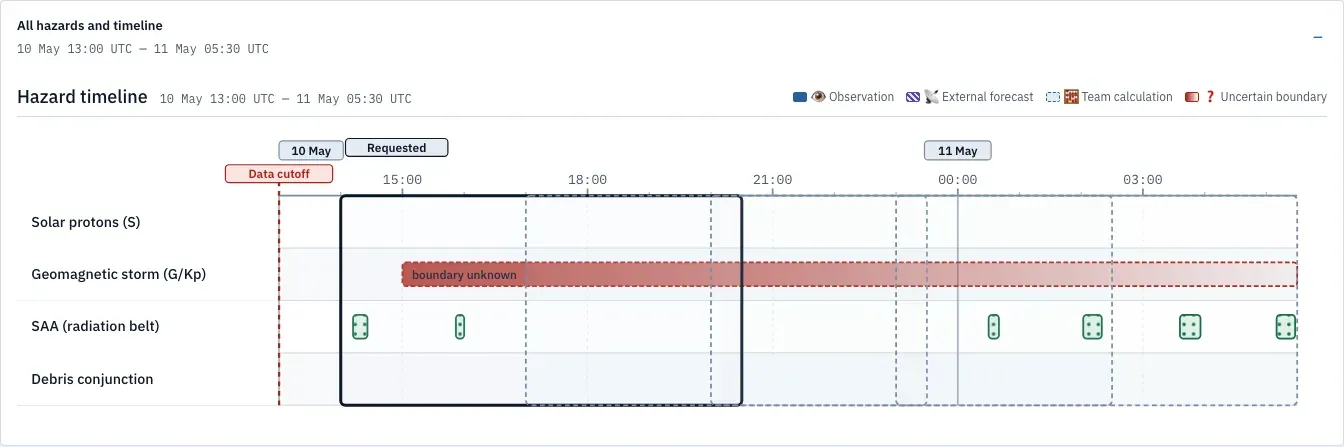
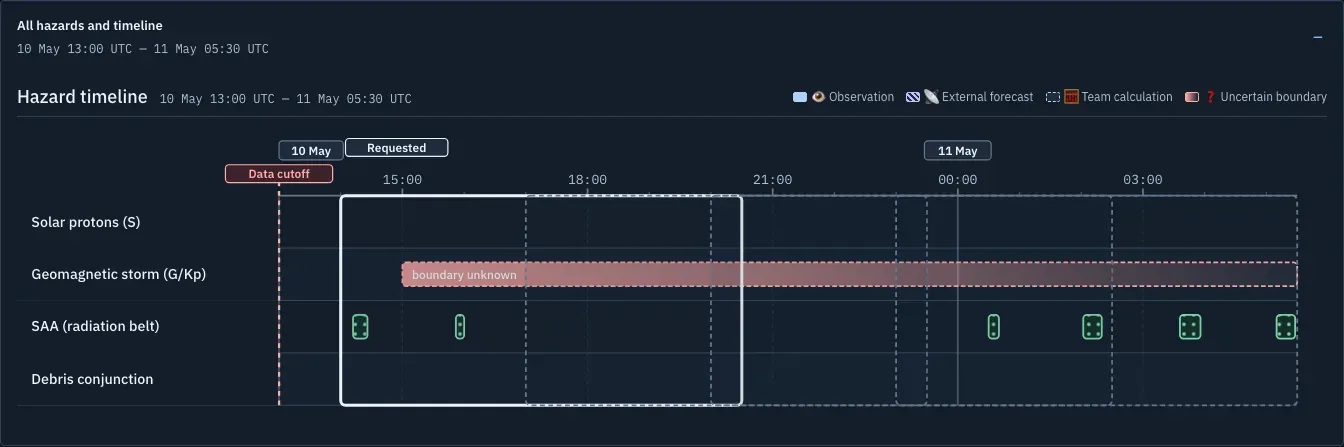
The timeline shows when each hazard overlaps the spacewalk, separating observations from forecasts.
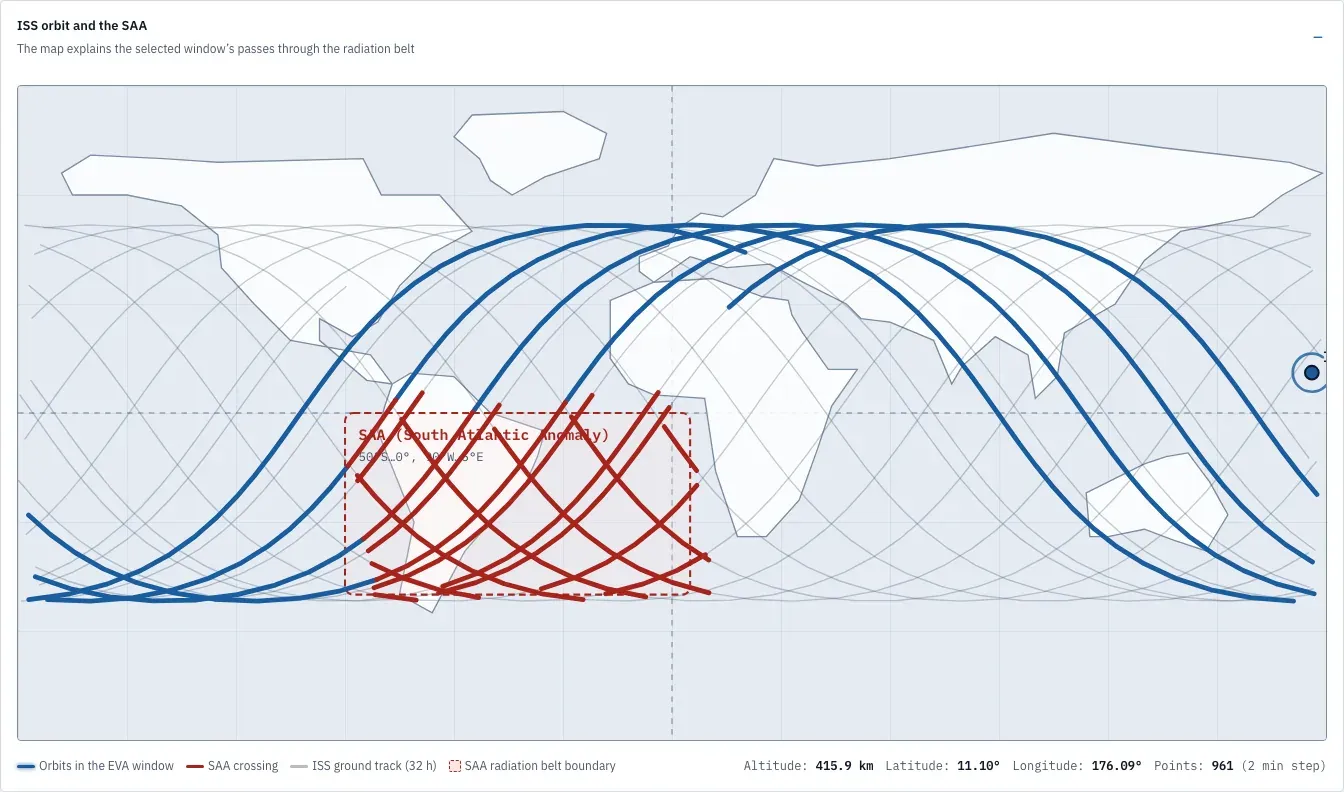
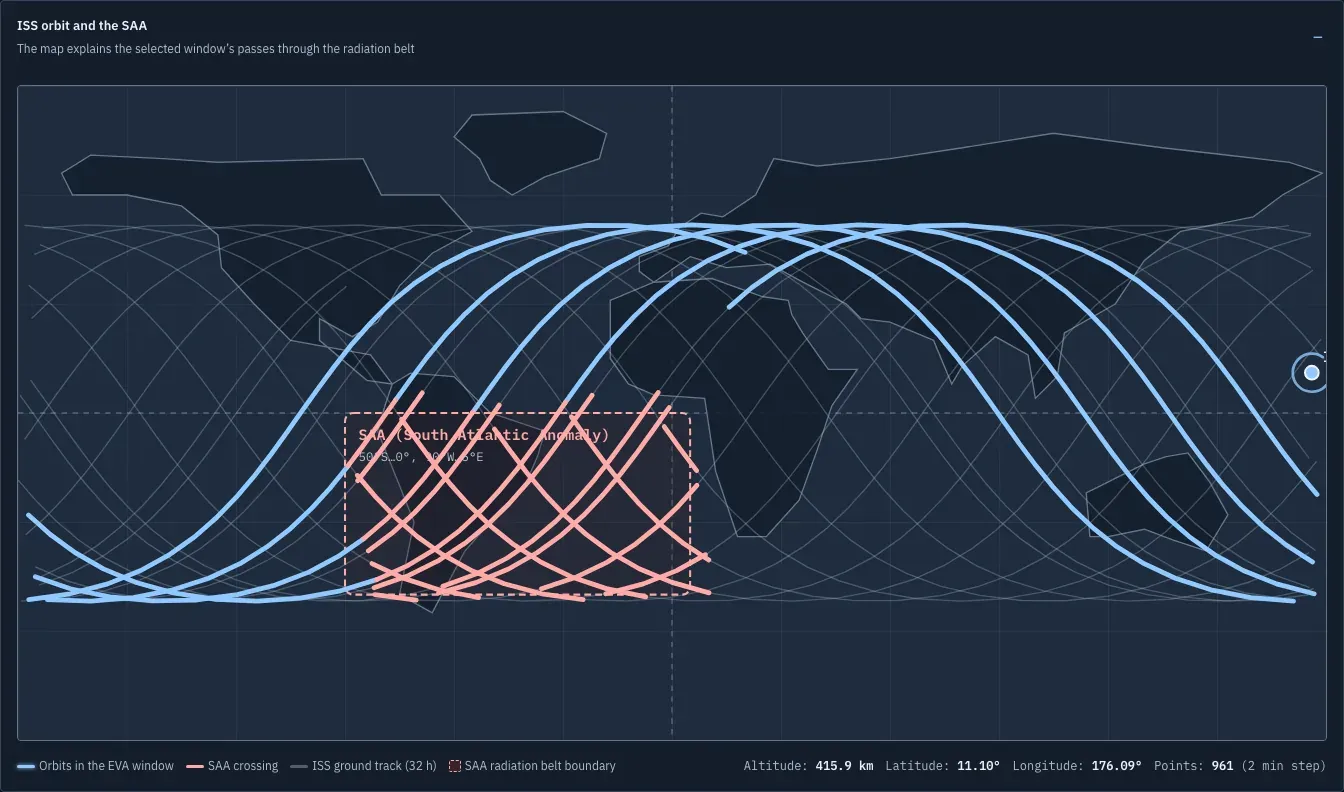
The orbit map: ISS passes through the South Atlantic Anomaly, where radiation is higher, drawn without a map library.
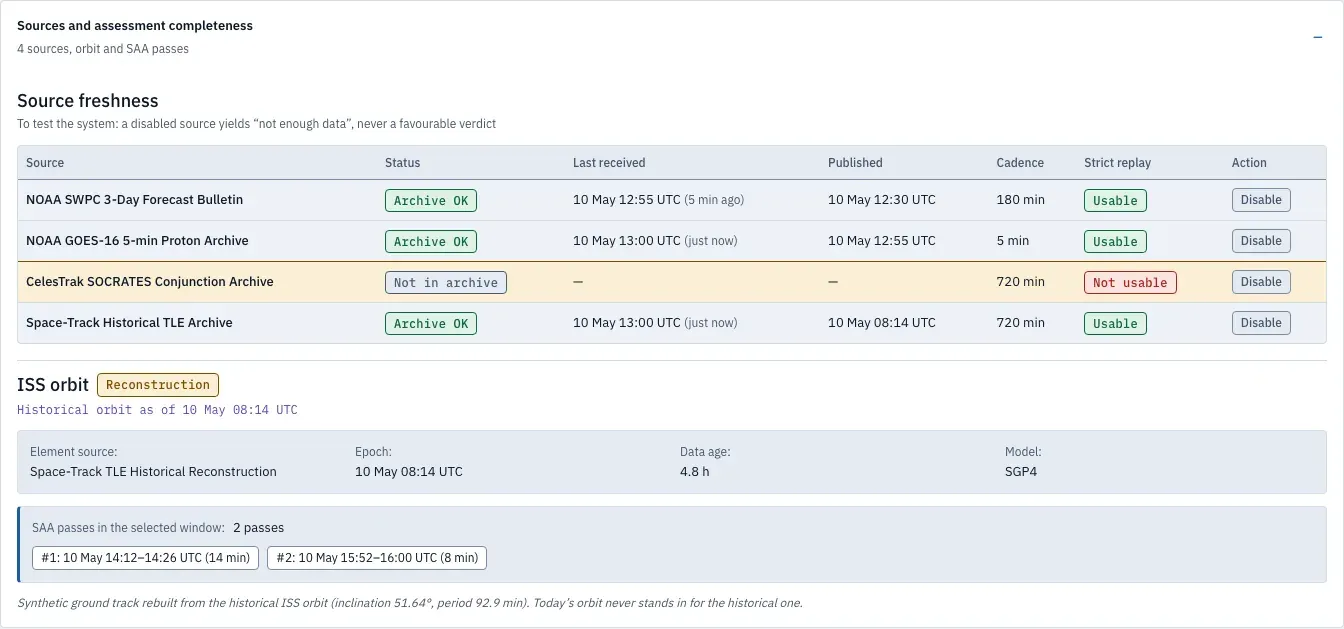
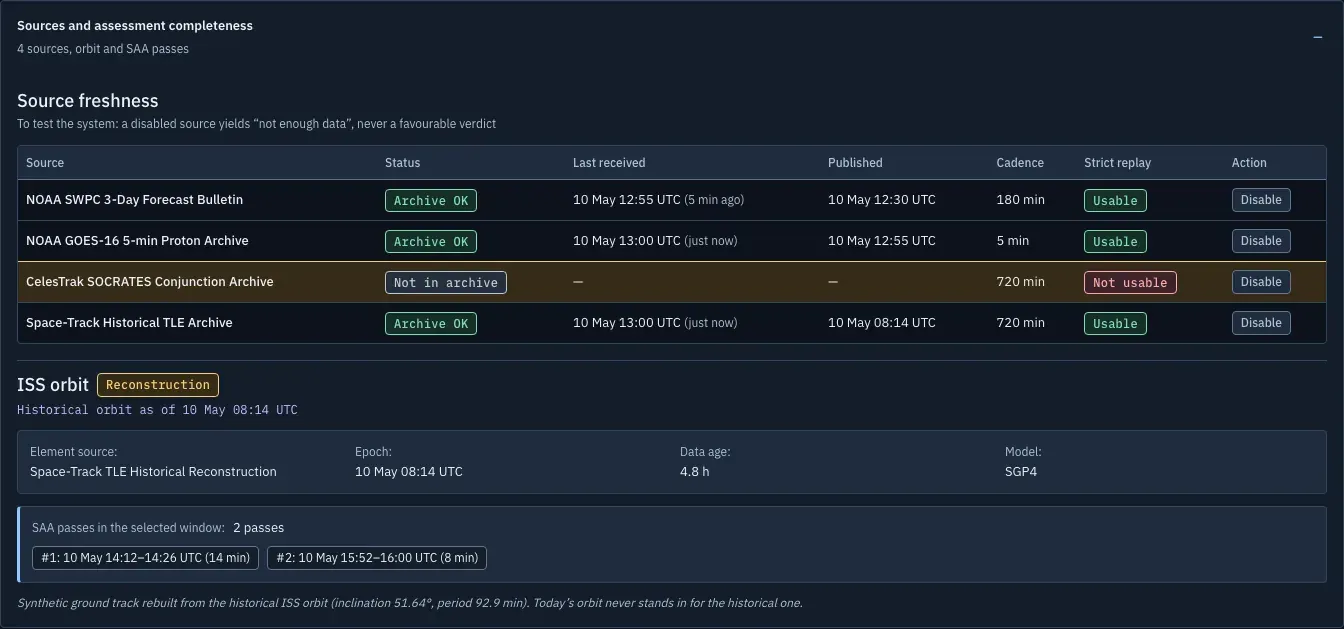
Data sources: how fresh each feed is, with a switch to turn one off and see the verdict become 'not enough data' instead of a false all-clear; below, the ISS orbit rebuilt with SGP4.
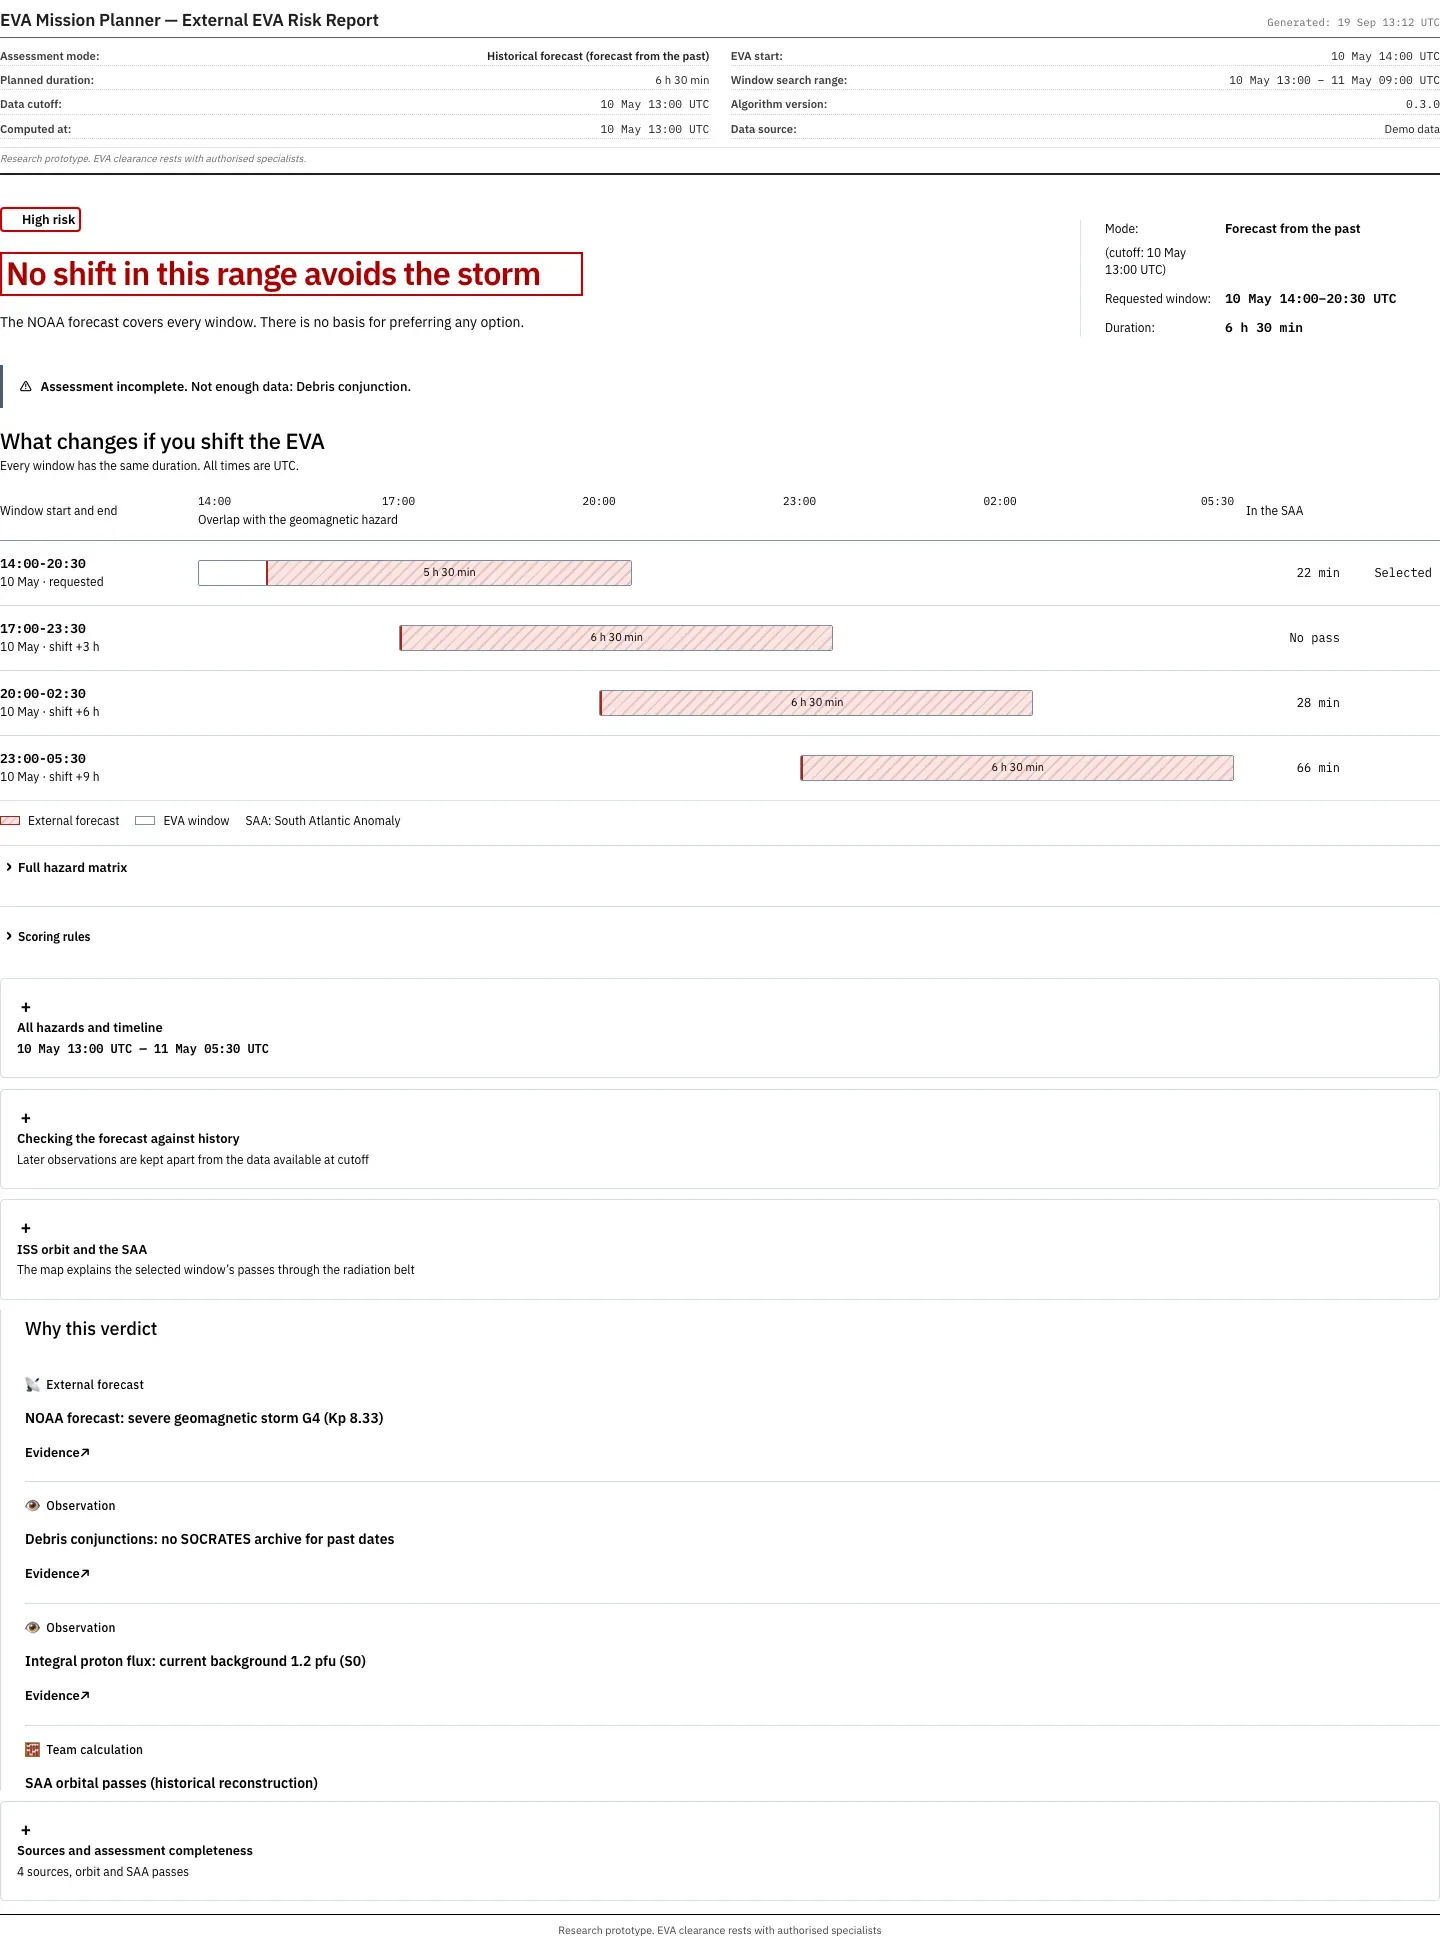
The print layout of the risk report for a paper briefing, always black on white (print preview, not a PDF).
1 / 7 The overview: a verdict in plain words, the windows side by side, and on the right why the system thinks so.
What it is
A spacewalk lasts six to seven hours, and the suit is the only shield. The people who plan one have to pull space weather, solar protons, radiation belts and debris warnings from separate sources and put them together by hand. EVA Mission Planner puts them on one screen.
An operator enters the planned start and length of a spacewalk. The system checks the requested window and shifted alternatives and shows them side by side, each with a risk level, the factors behind it and the sources it used. A timeline, alerts and a map of the ISS ground track over the South Atlantic Anomaly show why a window is risky. A sources panel says how fresh each feed is, and a feed can be switched off to see how the verdict changes when a sensor fails.
The tool does not make the go or no-go call. It supports the person who does: incomplete data can never produce a low-risk verdict, and every alert links to the raw value and the rule that fired.
There are three modes: current conditions, a historical review, and a historical forecast that replays a past date using only the data that was available at the time. The calculation can be saved as JSON, opened again later or printed for a briefing.
What I built
We split the work by role and agreed on JSON contracts between the parts. Vladislav built the data pipeline: NOAA SWPC and NASA space weather, debris conjunction data, GOES protons and archived orbital elements from Space-Track, with SGP4 propagation 32 hours ahead. Vyacheslav built the backend and the risk engine with an explainable chain of evidence. I built the operator interface on top of both and wrote the contract between the risk engine and the frontend.
The overview: a verdict in plain words, the windows side by side, and on the right why the system thinks so.
Replay of the G5 storm of May 2024: the system says honestly that no window in the range avoids it.
The full matrix: every risk factor for every window, and hatching where data is missing instead of a fake zero.
The timeline shows when each hazard overlaps the spacewalk, separating observations from forecasts.
The orbit map: ISS passes through the South Atlantic Anomaly, where radiation is higher, drawn without a map library.
Data sources: how fresh each feed is, with a switch to turn one off and see the verdict become 'not enough data' instead of a false all-clear; below, the ISS orbit rebuilt with SGP4.
The print layout of the risk report for a paper briefing, always black on white (print preview, not a PDF).
1 / 7 The overview: a verdict in plain words, the windows side by side, and on the right why the system thinks so.
Technical highlights
- Operator workspace in plain JavaScript, no framework: a verdict summary, a matrix that compares windows, a timeline, alerts with evidence, a sources panel and the planning form.
- Orbit map in pure SVG. The ISS ground track on an equirectangular projection, split at the antimeridian, with the South Atlantic Anomaly zone. No map library and no network requests.
- Contract first. I wrote version 2.1 of the contract between the risk engine and the interface, with mock scenarios, so the frontend was ready before the backend was and could fall back to mocks during the demo.
- Honest gaps. Missing data is drawn as hatching, not as zero, and a disabled source shows its status instead of disappearing.
- Export and print. A machine-readable JSON export, re-opening a saved file by drag and drop, and a print stylesheet for a paper copy.
- Late fixes in the backend. Near the deadline I fixed how windows were scored (storm thresholds, disabled sources) and made historical replays use archived orbital data instead of today’s orbit.
Result
Team ANTIGRAVITY took part in the Kosmo-Piter hackathon with a working prototype: the backend, the data pipeline and the interface ran together in a live demo. The code is in a private repository on the organizers’ GitVerse, so there is no public link. The screenshots come from a local run of the prototype on its demo data. The prototype itself has a Russian interface and a dark theme; the English text and the light theme were added to a local copy only for these screenshots, built from the app’s own colour tokens.
My role
Frontend and product lead. I designed and built the operator interface, wrote its data contract and the documentation, and made 15 of the repository’s 49 commits. The data pipeline and the risk engine were my teammates’ work.